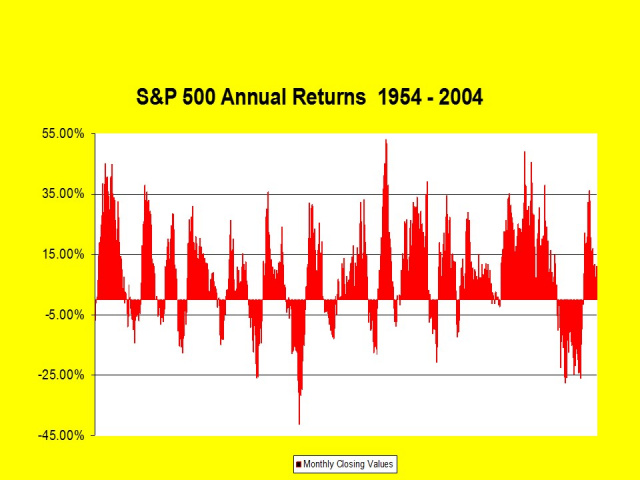
The first slide shows the market movements over 50 years, 1954-2004. Notice the ups and the downs or put another way, the gains and the losses. Did you know if you lose 33% in one year you must make a 50% gain the following year just to bring you back to the point before the 33% loss?
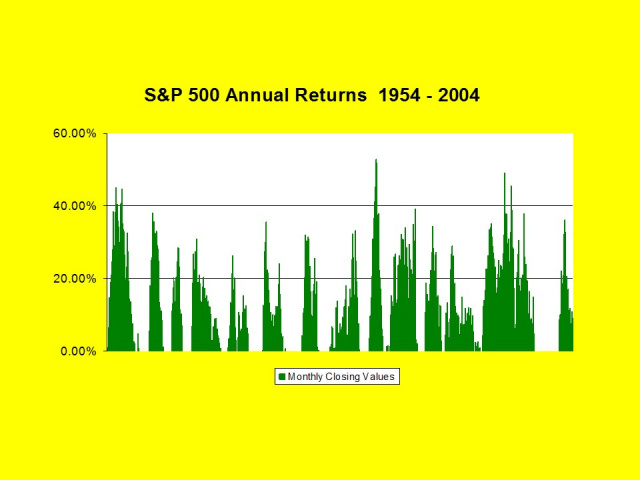
The second slide shows the same market movements over 50 years, 1954-2004, with one exception. The exception is there are NO LOSSES shown in this slide. Is that possible, to have all gains and no losses?
Yes, it is. More on this answer in a moment.
Over the last 60 years of stock market history there has been a decline averaging every 5 years. The last decline the US Stock Market had was 2009, where many market accounts dropped as much as 50% of their value.
It has been 8 years since the last decline. Is it possible we are about to have another one? Any person who studies history would answer "yes".
So how do you prepare yourself for the next decline and protect your assets?
How? We have an A Excellent rated insurance carrier who will give you 52% of every S & P 500 market index increase and 0% of the losses. Your money is ALWAYS protected against downturns.
You may have money in a retirement plan such as a 401K, Pension, or IRA or just a personal wealth accumulation plan made up of bank accounts or something else.
Whether personally owned money or money owned by a retirement trust like a 401K, either works just as I have described it above.
Call me at 214 692-9611 and let me tell you more today. Or, fill out this Contact Form.
|